
As a system grows, “monitoring” alone is no longer enough. CPU and RAM graphs tell you that a problem exists, but they don’t tell you why you’re experiencing it. The observability approach kicks in exactly here.
The difference between monitoring and observability
Monitoring usually answers the question “what happened?” Observability also answers questions like “why did it happen, which service did it start in, and how did it affect the user?”
In enterprise setups, these three data types in particular should be considered together:
- Metrics: Server and application numerics
- Logs: Event and error records
- Traces: The path of a request chain across services
The ideal flow
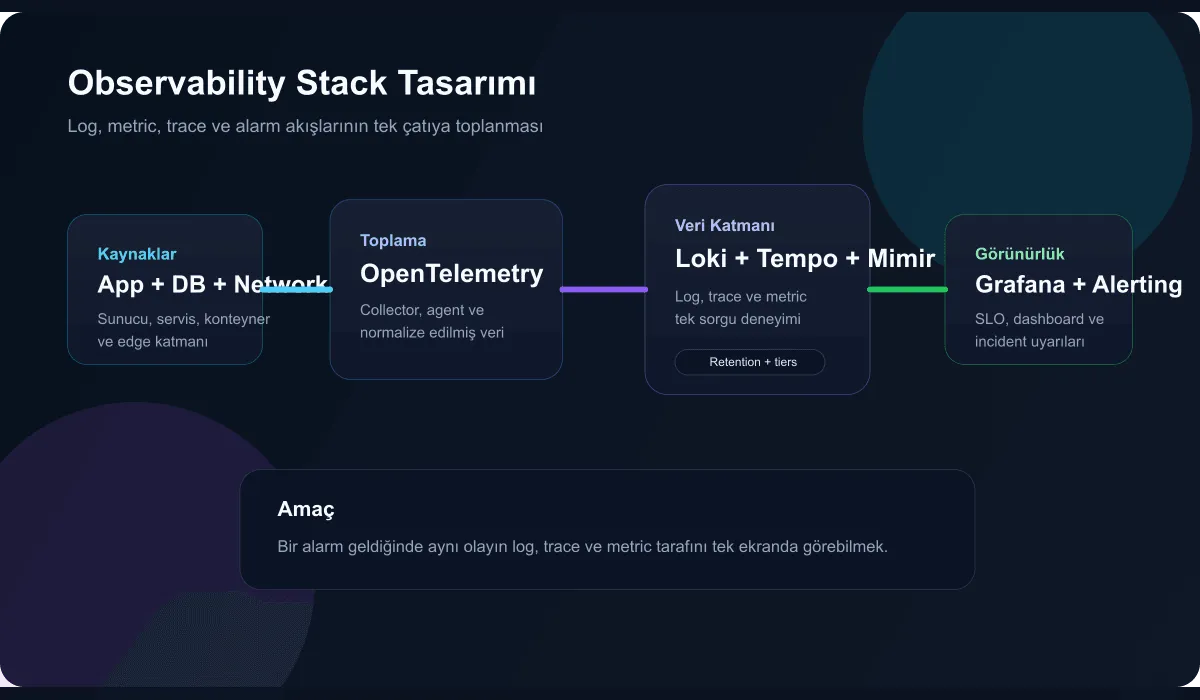
In the design I most commonly prefer, the data flow goes like this:
- Servers, applications, and network devices produce telemetry.
- The OpenTelemetry Collector normalizes the data.
- Logs, metrics, and traces are routed to the correct storage layers.
- Everything is queried in a single experience through Grafana.
- The alerting system triggers the incident process.
Why is the single-pane approach important?
When an alert comes in, the team should not be doing this:
- check the CPU graph on another screen
- then search logs in another tool
- then open a third tool for traces
Instead, from a single alert you should be able to traverse the log, metric, and trace chain of the same event. This visibly reduces MTTR, especially for critical services.
A practical stack example
- Metrics with Prometheus or Mimir
- Logs with Loki
- Traces with Tempo
- Dashboard with Grafana
- Collection with the OpenTelemetry Collector
This approach is both strong in the open-source world and flexible in terms of cost control.
receivers:
  otlp:
    protocols:
      grpc:
      http:

exporters:
  prometheusremotewrite:
    endpoint: http://mimir:9009/api/v1/push
  loki:
endpoint: http://loki:3100/loki/api/v1/pushThe basic distinction I make in alarm design
- Symptom alarm: a sign that affects the user
- Cause alarm: data pointing to the root cause
- Capacity alarm: an approaching risk
Without this separation, the team gets dozens of alarms for the same event but cannot tell which one truly matters.
Conclusion
A well-designed observability setup is not built just to watch systems but to understand them. In large environments, tying the log, metric, and trace layers into a single operational model is no longer a luxury — it is a basic requirement.