
When investigating network issues on Linux servers, teams often get squeezed between two extremes: either there’s far too little data, or the raw packet volume captured with tcpdump becomes operationally unmanageable. eBPF is a powerful tool that changes this equation. Used correctly, it lets you pull contextual signals from the kernel level — without dumping all the traffic to disk.
Why does eBPF make a difference?
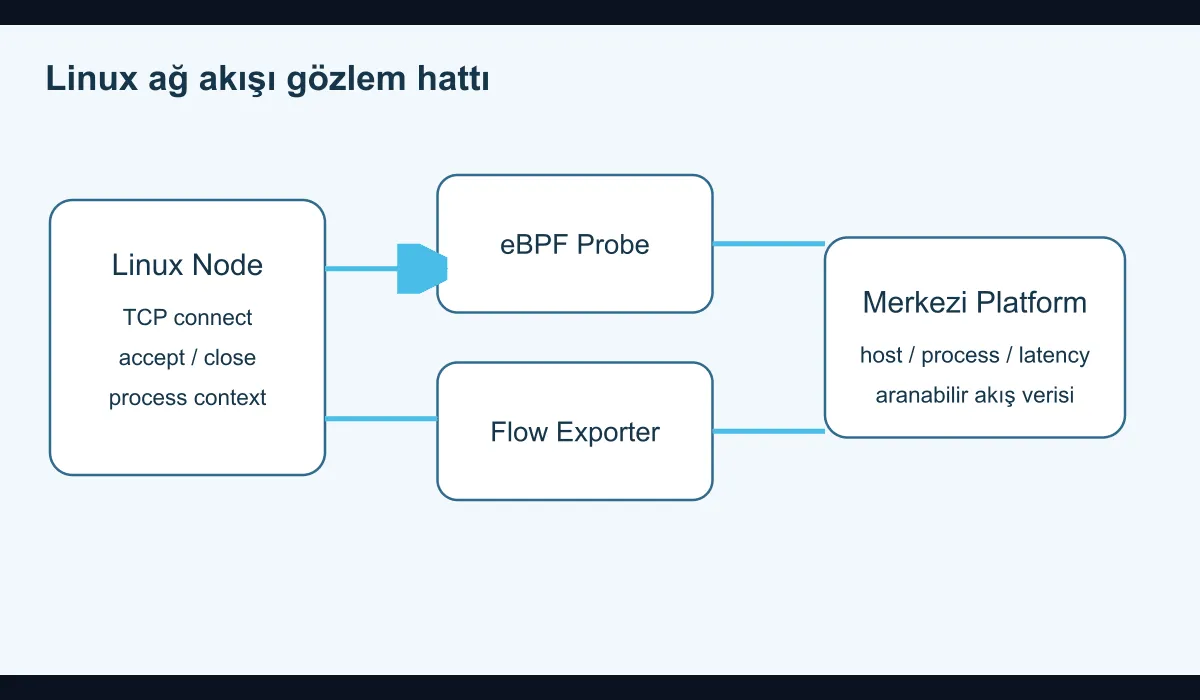
Traditional tools produce connection tables, packet captures, or limited interface counters. eBPF, by contrast, attaches programs to specific events inside the kernel and extracts more meaningful data. The practical outcome:
- You can monitor newly opened connections.
- You can see which process is talking to which destination.
- You can measure connection latency and reset behavior.
- You can ship network visibility to your observability platform with appropriate labels.
This is especially valuable in microservice environments, in systems with high connection density, or in setups crossing hybrid network boundaries.
Target signals to start with
Trying to collect everything in your first deployment is a mistake. First, get clear on which questions you want answered:
- Which processes are opening unexpected outbound connections?
- Which destinations are timing out the most?
- Are there recurring retry storms on the same node?
- Does the connection-close rate climb at certain hours?
It’s better to choose the event types your eBPF programs will produce based on these questions.
A safe rollout flow
A practical onboarding sequence looks like this:
- First, pick the node groups you’ll observe.
- Verify that the kernel version and security settings are compatible with eBPF usage.
- Start with low-volume connection events.
- Restrict the fields you collect; don’t copy every packet.
- Stream the results into your central log or metric system.
Which fields must always be tagged?
When events flow into the central platform, the following fields become critical:
host.nameprocess.namedestination.ipdestination.portconnection.statelatency_msenvironment
Thanks to these labels, not only network behavior but also workload ownership becomes visible. This is mandatory especially when many services run on the same node.
Operational use cases
eBPF-based flow data significantly accelerates these scenarios:
- The application is slow but the infrastructure metrics look normal
- Sudden bursts of connection resets
- Unexpected DNS or external service dependencies
- Lateral movement investigations by the security team
Tracking connection behavior without inspecting packet contents is a more sustainable path, both in terms of cost and privacy.
Limits to watch out for
eBPF is very powerful; that’s why uncontrolled use creates new problems:
- Producing too many events can put pressure on CPU and memory.
- Collecting raw IP data without context produces no meaningful results.
- Don’t expect identical behavior across every kernel version.
- Failing to tie collected data to a labeling standard reduces analysis value.
For these reasons, you should profile on a limited node group before moving to production.
Conclusion
eBPF isn’t merely a new tool for Linux network observability; it’s a more accurate level of abstraction. Instead of being stuck between the world of raw packets and inadequate counters, it lets you obtain process- and flow-oriented, meaningful telemetry. In enterprise environments, the best results come when you start with small but specific questions and bind eBPF data to a central observability model in a disciplined way.