
When service latency rises, most teams reach for application logs first. Yet for some problems the answer doesn’t live in the application layer at all — it’s hidden in network behavior at the kernel level. eBPF-based flow observability opens a powerful window here: without paying the cost of full packet capture, you can correlate kernel-level network events with service-level SLO signals.
Why metrics alone don’t solve this
CPU, memory, and request-rate metrics are enough in many situations. But when the network queue, retransmissions, connection terminations, or latency distributions degrade, you need finer-grained signals. Especially:
- When the node looks healthy but specific service calls are slowing down
- When the same application behaves well in some regions and poorly in others
- When the issue isn’t packet loss but connection-level behavior
eBPF gives you low-level visibility into exactly these system calls and network events.
What’s the minimum viable architecture?
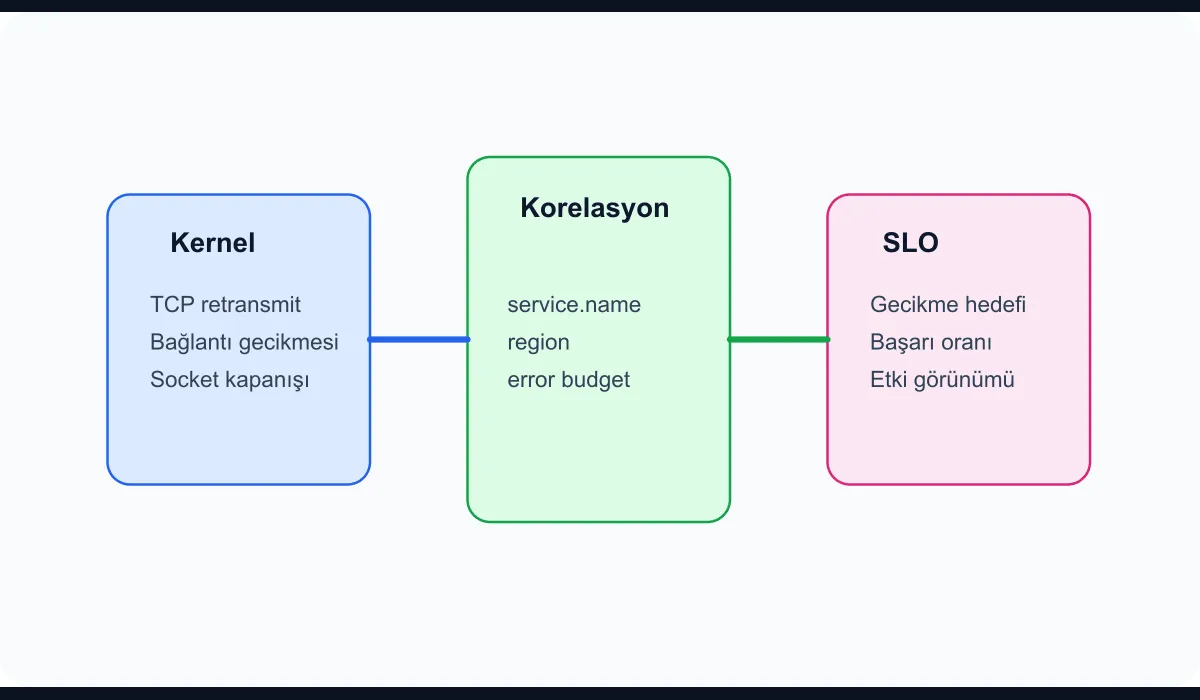
Three components are enough to get started:
- eBPF sensor: Captures socket, TCP, or network-latency events.
- Collection layer: Forwards measurements to the central telemetry pipeline.
- Correlation layer: Maps network signals to service name, environment, and SLO indicators.
The goal is to produce meaningful visibility from as little data as possible. Rather than recording every packet, gathering enough flow summary to drive a decision is far more sustainable.
Which signals are worth starting with?
In the first phase, these signals deliver the most value:
- TCP retransmit count
- SYN wait duration
- Connection establishment latency
- Socket close reasons
- Per-target service or port flow volume
If interpreted in isolation, this data produces too much noise. The real value emerges when you combine it with the SLO view.
A simple correlation example
For instance, the order service is burning through its error budget faster than usual, and at the same time you observe these signals:
- TCP retransmit rate is climbing on a specific node group
- Connection setup time is growing on upstream calls in that same group
- No obvious errors appear in the application logs
In this case, the issue is more likely on the network or infrastructure path than in the application code itself. eBPF data helps translate the “service is slow” observation into “which network behavior is broken?”
What to watch out for on the collection side
eBPF tools are powerful, but used without restraint they generate cost. Pay attention to:
- Don’t enable peak sampling on every node simultaneously
- Verify kernel version compatibility
- Forward pre-summarized metrics or flow records rather than raw events
- Keep only the probes that drive operational decisions
Starting small and expanding once value is proven is the healthiest path.
Why correlation with SLOs matters
The most common mistake in observability work is treating a new data source as just “more data.” But eBPF data only reveals its value once it’s tied to service objectives:
- Which network anomaly actually reached the user?
- Which degradation stayed at the infrastructure layer?
- Which node or segment is genuinely consuming the error budget?
This way teams stop reacting to every kernel signal and instead focus on the behaviors that create real user impact.
Conclusion
Network flow observability with eBPF weakens the invisible wall between network and application teams. When kernel-level behavior is combined with service objectives, performance regressions and regional anomalies in particular become much faster to diagnose. Strong observability isn’t more dashboards; it’s matching the right level of signal with the right business impact.