
In server and Kubernetes environments, the following picture tends to emerge over time: a separate agent for metrics, another for logs, yet another collector for traces, and a different configuration model for each of them. This fragmented setup is tolerable at small scale, but in enterprise systems it produces serious operational cost in version management, label standards, and resource consumption. Grafana Alloy is a strong candidate for consolidating this scattered agent landscape into a single data collection layer.
Which problem does Alloy solve?
The real problem is not the number of agents but how they are managed. With separately running tools, the following issues compound:
- Each agent requires its own rollout procedure.
- Label standards drift over time.
- Unnecessary resource consumption stacks up on the same host.
- When something breaks, identifying which layer dropped data becomes difficult.
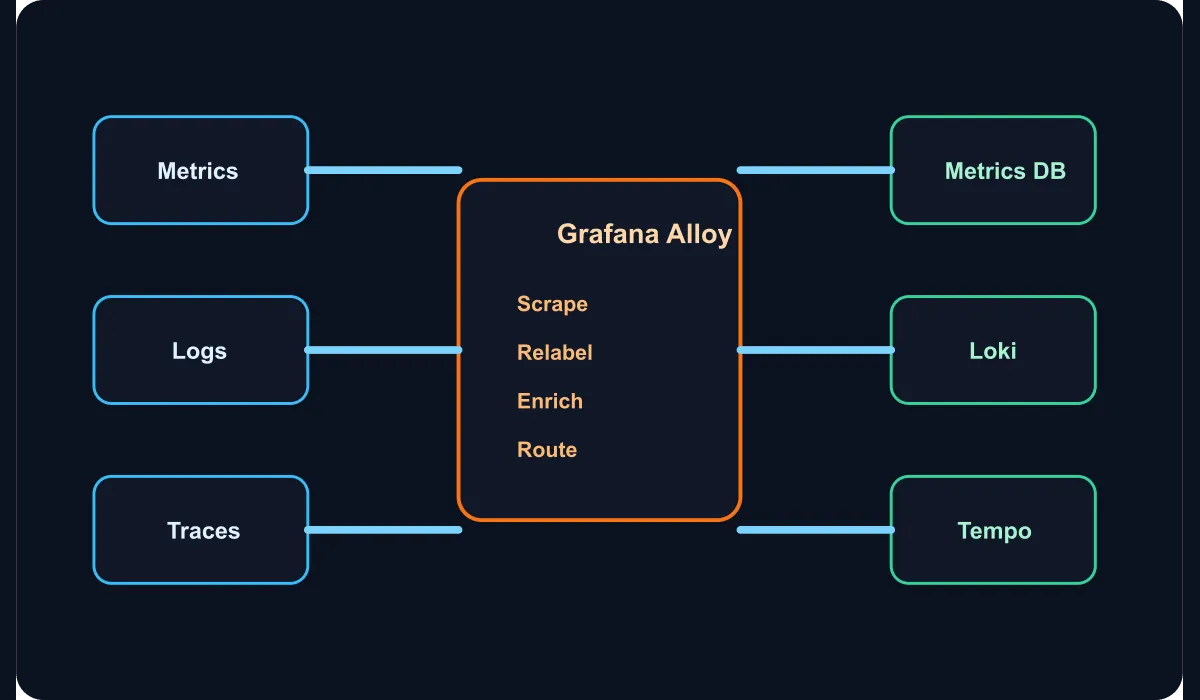
By unifying Prometheus scrape, log collection, and OpenTelemetry data flows under a single structure, Alloy reduces this problem.
Where should you start?
In the first phase, take an inventory of your existing agents. Typically these three flows show up:
- System and application metrics
- Application and platform logs
- Trace or OTLP based telemetry
The goal is not to remove every agent on day one. Running Alloy side-by-side first to observe the data model and resource impact is the safer path.
Example architecture
In a practical starting architecture, Alloy can take on the following responsibilities:
- Scrape system metrics similar to a node exporter.
- Collect logs from files or journald.
- Accept application telemetry over OTLP.
- Apply common labels across every flow.
- Route data to Prometheus-compatible metric storage, log storage, and a trace backend.
A simple Alloy pipeline
The example below provides a minimal starting logic that collects system metrics and logs from a host and routes them to centralized targets:
prometheus.exporter.unix "node" {}

prometheus.scrape "node" {
  targets    = prometheus.exporter.unix.node.targets
  forward_to = [prometheus.remote_write.metrics.receiver]
}

loki.source.file "system" {
  targets    = [{__path__="/var/log/*.log", job="system"}]
  forward_to = [loki.write.logs.receiver]
}

prometheus.remote_write "metrics" {
  endpoint {
    url = "https://metrics.internal/api/v1/write"
  }
}

loki.write "logs" {
  endpoint {
    url = "https://logs.internal/loki/api/v1/push"
  }
}
As this structure grows, it can be extended with discovery, relabel, and OTLP pipelines.
The most critical topic: labels and ownership
The single-agent model only delivers value when the data layout is sound. For that reason, standardize the following fields:
environmentteamserviceregioncriticality
These labels form the backbone of alert routing, dashboard grouping, and incident analysis.
How should the migration be done?
The migration order I recommend is as follows:
- Bring Alloy online in parallel with existing agents.
- Validate data volume and label mapping.
- Decommission the lowest-risk agent first.
- Monitor signals around resource usage and data loss.
- Roll out in waves based on host classes.
This approach lets you progress without putting the entire observability layer at risk all at once.
Conclusion
Agent consolidation with Grafana Alloy is not an exercise in reducing the number of tools — it is the work of making telemetry production manageable and consistent. Especially in environments with a large number of servers, hybrid networks, and enterprise services, the single-agent approach reduces operational complexity, accelerates standardization, and increases trust in the data pipeline during incidents.