
In ERP infrastructures, monitoring most often produces a great deal of data while delivering little context. CPU, disk, queue depth, batch duration, integration errors, user sessions, the report queue, and database wait statistics live in separate systems. Technically, everything appears to be monitored; but when a business-critical flow breaks, teams cannot decide which signal to prioritize. For this reason, strong observability in an ERP environment is not just about adding more dashboards. The real need is a control-room model that accelerates operational decisions.
Why isn’t classic monitoring enough?
Because in the ERP world, problems rarely live in a single layer. On the user side, the complaint is “the order won’t approve”; underneath, the integration queue has filled up, the message consumer has fallen behind, a particular table lock in the database has lengthened, and the batch job has overshot its window. This picture cannot be tracked sufficiently with separate dashboards.
The control-room approach answers this question: “Which business flow is currently at risk, and which technical signals support that view?”
What do I mean by “control room”?
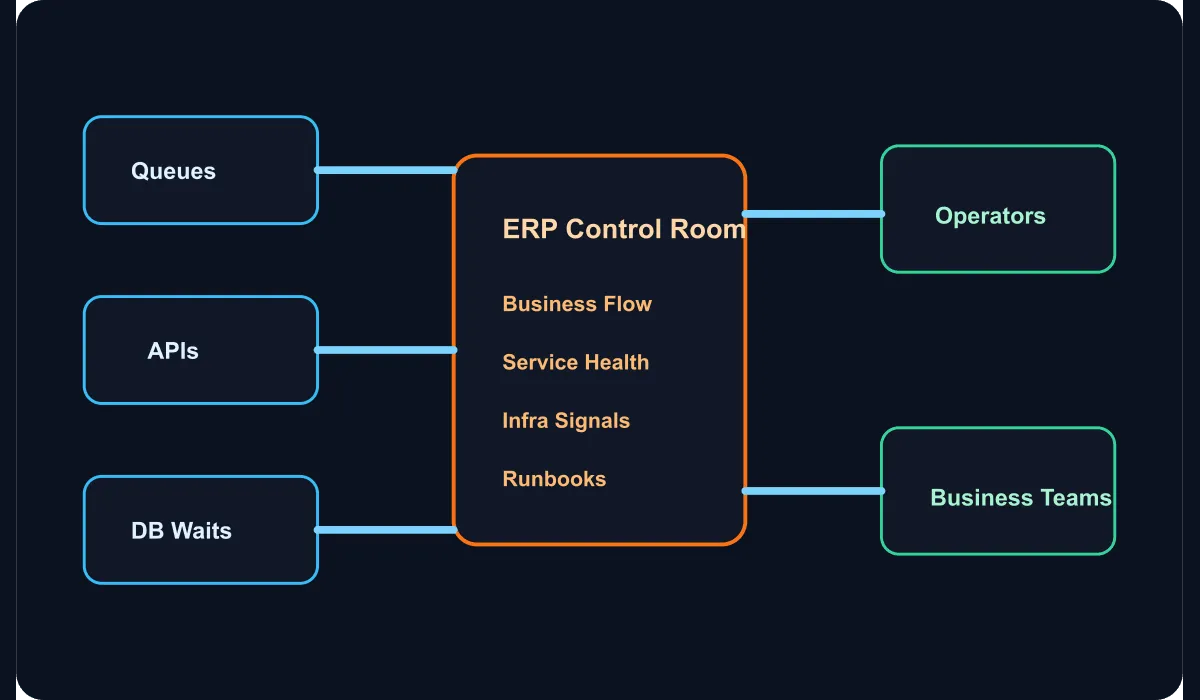
The model I use consists of four layers:
- Business workflow view
- Service and integration health
- Infrastructure and capacity signals
- Response and communication flow
The critical point is not to pile metrics onto a single screen, but to associate business impact with technical dependencies. For example, the signal “invoice generation is delayed” should appear in the same context as the related queue lag, the API error rate, and the database wait metric.
Which flows belong at the center?
In an ERP environment, it is a mistake to make everything a primary panel. The most critical business flows must be selected first for the control room:
- The chain from order to shipment
- Finance closing and reconciliation tasks
- Stock updates and warehouse synchronization
- Calendar-bound batch processes such as HR or payroll
If a “normal operating band” is defined for each of these flows, anomalies are noticed much earlier.
How should technical signals be mapped?
In a good control room, signals like these sit beneath each business flow:
- Latency and queue depth
- Success rate and error classes
- Dependent service availability
- Data freshness
- Batch window adherence
For stock synchronization, for instance, API response time alone is not enough. The time of the last successful transfer, the number of pending messages, and the acceptance rate at the destination system must be evaluated together.
Alarm design is not a separate topic
The weakest link in the control-room model is often alert routing. Routing every threshold breach to the same on-call channel exhausts ERP teams very quickly. A better model makes this distinction:
- Informational deviations
- Events requiring operational intervention
- Critical breakages that have caused business impact
Without this classification, even a tidy dashboard leaves the incident flow chaotic.
Data sources do not have to come from a single vendor
In enterprise environments, the ERP platform may not be built on a single product. Metrics may sit in Prometheus, logs elsewhere, APM in a different tool, and batch reports in the application database. That alone is not the problem. The problem is when these data sources are not bound to a shared vocabulary.
My recommendation is to make these common fields mandatory:
- Business workflow name
- Service owner
- Environment and region
- Criticality level
- Related runbook or response link
These fields establish a single language in operations, even when the tooling is heterogeneous.
How do you know you have succeeded?
The value of an ERP control room is measured not by the number of dashboards but by the quality of incident response. The good signals are:
- The time to notice an issue gets shorter.
- The meeting traffic spent on the initial diagnosis decreases.
- Business units and the technical team describe the same incident with the same words.
- The phrase “the data was there but we couldn’t connect it” appears less often in postmortems.
This shows that observability has shifted from producing reports to operational governance.
Conclusion
Building an observability control room in ERP infrastructures is not about producing flashier dashboards; it is about binding the business workflow, the technical signal, and the response style to the same model. A control room designed around critical processes both speeds up incident management and exposes invisible dependencies in the enterprise technology architecture. In high-impact systems like ERP, real observability is exactly this: not data abundance, but decision clarity.