
Measuring service reachability only from inside is often misleading, especially in enterprise networks. The application pod is up, the node is healthy, the load balancer is responding; yet from a particular office segment, partner network, or internet exit, the service is in fact unreachable. Blackbox Exporter is a very effective tool for closing this blind spot. Used correctly, it does not become a synthetic probe page; it becomes a reliable signal layer that measures the network experience from different vantage points.
What will we set up?
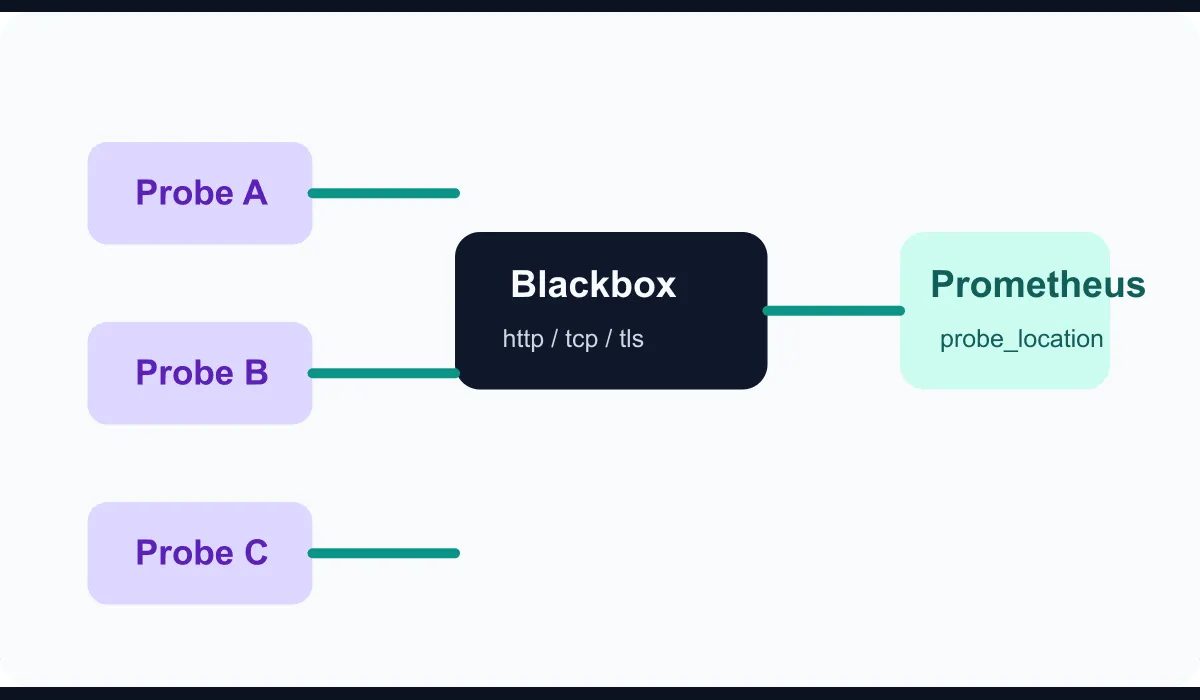
In this guide we will build the following model:
- Multiple probe clients running in different network zones
- Blackbox Exporter performing HTTP and TCP checks
- Prometheus collecting the results
- A labeling structure that produces alarms by target and location
The goal is to answer “is the service up?” not from a single location in a misleading way, but in a form that shows from which location it is up.
1. Prepare the Blackbox Exporter configuration
The first step is defining the check modules. The example below offers a clean starting point for HTTP 2xx, TCP connectivity, and TLS certificate validity:
modules:
  http_2xx:
    prober: http
    timeout: 5s
    http:
      method: GET
      preferred_ip_protocol: ip4
      valid_status_codes: [200, 301, 302]

  tcp_connect:
    prober: tcp
    timeout: 5s
    tcp:
      preferred_ip_protocol: ip4

  tls_expiry:
    prober: tcp
    timeout: 5s
    tcp:
      tls: true
      tls_config:
        insecure_skip_verify: false
The important point here is not to push every problem into a single module. HTTP reachability, raw TCP reachability, and TLS validation produce different alarm surfaces.
2. Place the exporter at different points
The real value comes out at this step. If you run Blackbox Exporter only on the central monitoring network, you remain trapped at a single viewpoint. Instead consider locations such as:
- Central data center exit
- An in-VPC monitoring segment in cloud
- A branch or remote office exit
- An independent probe point on the public internet
Each probe can monitor the same target; only the probe_location label differs. That way you can more quickly tell whether the outage is really at the service layer or on a particular access path.
3. Add the Prometheus scrape definition
The example below passes the target to Blackbox Exporter as a parameter and turns the target URL and probe location into labels in the result:
scrape_configs:
  - job_name: blackbox-http
    metrics_path: /probe
    params:
      module: [http_2xx]
    static_configs:
      - targets:
          - https://app.mustafaerbay.internal/health
          - https://erp.mustafaerbay.internal/login
        labels:
          probe_location: dc-core
    relabel_configs:
      - source_labels: [__address__]
        target_label: __param_target
      - source_labels: [__param_target]
        target_label: instance
      - target_label: __address__
        replacement: blackbox-exporter.monitoring.svc:9115
The same block can be repeated for different points across separate Prometheus instances or in regional aggregation layers running with federation.
4. Do not build the alarm logic on a single failing probe
In enterprise networks, transient DNS, route, or egress problems are unavoidable. So building alarms on a “one probe failed” basis only generates noise. A better approach is to define location-majority logic or critical-location thresholds.
For example:
- If the internet probe and two internal probes drop at the same time, raise a critical alarm
- If only a single branch probe drops, raise a medium alarm
- If TLS validity falls below 14 days, raise a maintenance alarm
This model aligns synthetic monitoring with the real priorities on the ground.
5. Connect the results to service ownership
Blackbox Exporter can be very useful; but if the target list is left unowned, it quickly turns into a stale dashboard. For that reason, keeping the target definitions alongside metadata like the following works well:
- The owning service team
- Business impact level
- Expected access surface
- Related TLS domain
- Escalation policy
This way the alarm output is connected directly to the right team.
6. A simple PromQL example
To see the failed probe ratio by location, the following query is useful:
avg by (instance, probe_location) (
  probe_success{job="blackbox-http"} == 0
)
And to track the remaining certificate days:
(probe_ssl_earliest_cert_expiry - time()) / 86400When these two queries are used together, both reachability and certificate hygiene become visible on a single panel.
Conclusion
Setting up multi-point service health monitoring with Blackbox Exporter is a strong step toward seeing reachability from real access paths rather than from inside the application. When you build location-aware synthetic measurement instead of probes running from a single center, you can isolate breaks in the network, DNS, TLS, and edge layer faster. Well-designed synthetic monitoring produces not more alarms but more accurate context.