
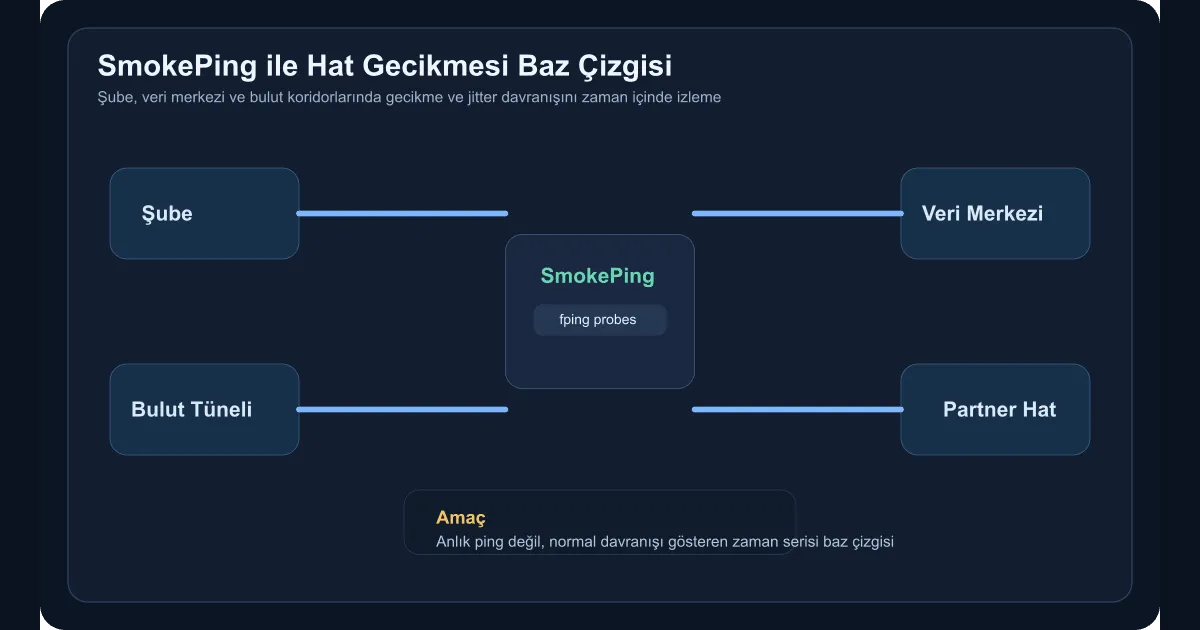
Most network problems aren’t caught with “is the link up or down?”. The actual issue is usually intermittent latency spikes, rising jitter, and link behaviour that degrades only at certain hours. Especially with branch connections, MPLS exits, internet VPN corridors, and cloud tunnels, a one-shot ping rarely produces enough signal. SmokePing is still strong for this space because it lets you see latency behaviour over time as a baseline.
When does this actually pay off?
SmokePing earns its keep in cases like:
- When users on branch-to-HQ links say “it’s slow sometimes”
- When cloud VPN or IPSec tunnels show latency spikes only at certain hours
- When the SaaS or external service link shows jitter rather than packet loss
- When network teams and application teams interpret the same performance issue differently
In these situations, what you need isn’t another dashboard — it’s shared ground truth. A baseline gives you that.
Setup approach
In this guide, we’ll watch three different target groups from a single SmokePing node:
- Branch routers
- Data center gateways
- Critical endpoints inside cloud
Basic install on Ubuntu or Debian is straightforward:
sudo apt update
sudo apt install smokeping fping apache2 -y
sudo systemctl enable --now smokeping
After the install, the actual work isn’t sending packets — it’s grouping the targets in a way that carries operational meaning.
How should target groups be designed?
My preference is to name them by behaviour, not by location:
branchesdatacenter-gatewayscloud-egresscritical-partners
That way, when you look at a graph, you see not just an IP but which business corridor you’re watching. An example Targets layout:
*** Targets ***

+ branches
menu = Sube Hatlari
title = Sube Hatlari

++ izmir
menu = Izmir
title = Izmir Sube GW
host = 10.10.20.1

++ ankara
menu = Ankara
title = Ankara Sube GW
host = 10.10.30.1

+ cloud-egress
menu = Cloud Cikis
title = Cloud Cikis Noktalari

++ prod-vpn
menu = Prod VPN
title = Prod VPN Gateway
host = 172.16.10.1
It looks small, but later it pays off heavily for problem correlation.
Why does the baseline concept matter?
A link showing 22 ms of latency isn’t good or bad on its own. If that link is normally at 8 ms, you have a problem. If it’s normally at 20 ms, you don’t. That’s exactly where SmokePing pays off. Once normal behaviour becomes visible over time, you can answer questions like:
- Is the latency rise continuous or cyclical?
- Does jitter only climb at certain hours?
- Is the issue local to one site or spread across the corridor?
- Does the application complaint line up in time with the network signal?
Without this data, mid-incident, everyone defends a different version of reality.
How should alerts be produced?
SmokePing isn’t a complete alerting platform on its own. But it can produce the deviation-from-baseline signal. In practice this approach works:
- Review SmokePing graphs on a regular cadence
- Set average and jitter thresholds for specific target groups
- Use small check scripts that forward this data into Prometheus or another monitoring layer
The first goal shouldn’t be a flood of instant alerts. Read the normal behaviour first, then set thresholds. Otherwise the system just becomes noise.
Which mistakes are common?
The most widespread mistake is choosing only public internet addresses as targets. That makes internal behaviour hard to see. The second is staring at graphs without ever defining action thresholds — at which point SmokePing becomes a decorative tool.
Another important one is leaving the interpretation to the network team alone. In areas like branch ERP access, cloud API latency, or remote backup corridors, application and platform teams also benefit from this baseline.
Wrap-up
Building a link latency baseline with SmokePing isn’t just about producing ping graphs. The approach pulls network performance out of momentary intuition and makes it readable through historical behaviour. Especially across enterprise links connecting branches, data centers, and cloud, this baseline has to exist before any meaningful debate can start.