
In enterprise environments the log-collection problem usually starts with the question, “which platform should we use?” The more important question is actually different: how do we move logs that come in different formats, at different frequencies, and with different risk profiles across the same delivery backbone? Vector is a strong tool for that job because it is more than an agent; it also lets you build the transformation, enrichment, and routing layers in a clean way.
In this guide we put together a basic skeleton that gathers multiple log sources with Vector and routes them to two different destinations.
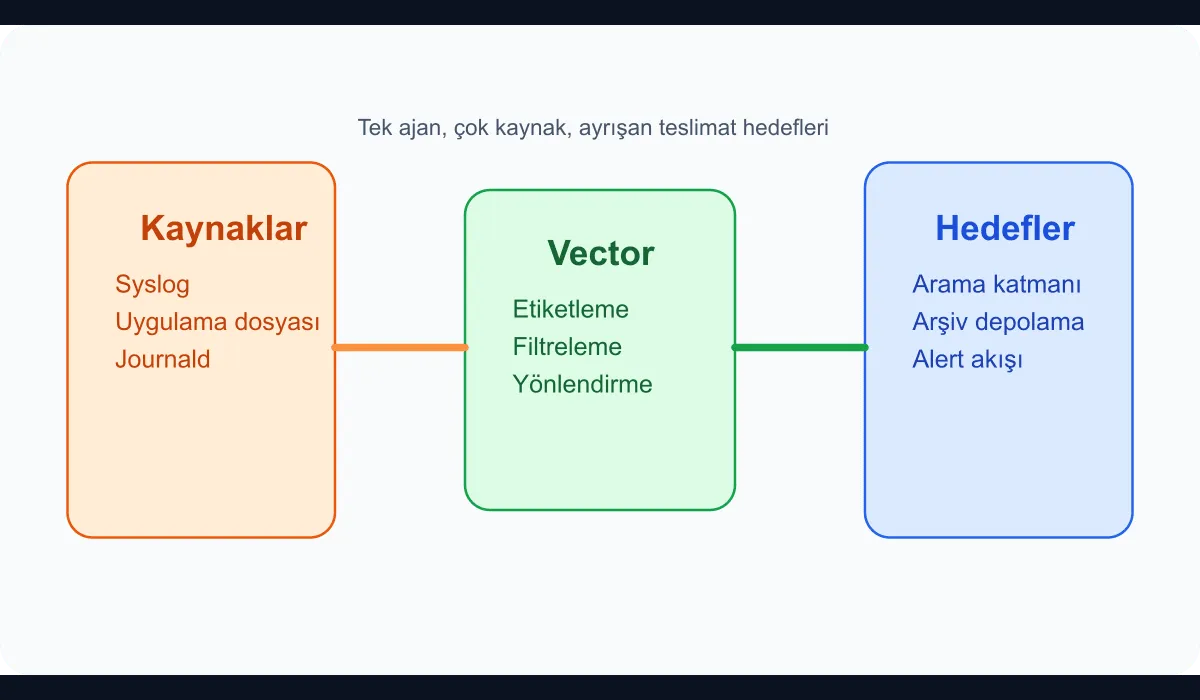
When does this fit?
This model is quite useful in the following situations:
- Syslog is flowing in from Linux servers.
- Applications produce JSON or line-based logs.
- Some logs need long-term storage; others need a fast search system.
- A common labelling standard and filter logic should be managed centrally.
In this example we will take three sources:
/var/log/messages- An application log file
- Journald
Basic Vector configuration
Let’s define the sources first:
[sources.syslog_file]
type = "file"
include = ["/var/log/messages"]
read_from = "beginning"

[sources.app_file]
type = "file"
include = ["/srv/apps/*/current/log/app.log"]
read_from = "end"

[sources.journald]
type = "journald"
current_boot_only = true
Collecting application logs with a wildcard in particular reduces config duplication when many services share the same host.
A shared enrichment layer
Collecting sources isn’t enough on its own. You also have to know quickly which environment, service, and node the log came from. We can do that with remap:
[transforms.normalize]
type = "remap"
inputs = ["syslog_file", "app_file", "journald"]
source = '''
.environment = "production"
.host = get_hostname!()
.team = "platform"

if exists(.file) && includes!(.file, "/srv/apps/") {
  .log_type = "application"
} else {
  .log_type = "infrastructure"
}
'''
One of the biggest issues in larger organisations is that the same event ends up being searched with different labels by different teams. This layer establishes a shared vocabulary right at the collection point.
Reduce noise early
Sending every log line to the same destination unchanged is expensive. Health checks, routine cron output, and repeated low-value records in particular drive up indexing cost. Let’s add a simple filter:
[transforms.filter_noise]
type = "filter"
inputs = ["normalize"]
condition = '''
!match(string!(.message) ?? "", r'healthcheck|/readyz|/livez')
'''
You shouldn’t make this filter too aggressive. In the early stages, routing noisy data to a separate destination tends to be safer than dropping it.
Routing to two destinations at once
Now let’s send the same stream both to a search layer (Elasticsearch-style) and to long-term object storage:
[sinks.search]
type = "http"
inputs = ["filter_noise"]
uri = "https://logs.example.internal/ingest"
encoding.codec = "json"
compression = "gzip"

[sinks.archive]
type = "aws_s3"
inputs = ["normalize"]
bucket = "central-log-archive"
region = "eu-central-1"
key_prefix = "vector/%Y/%m/%d/"
encoding.codec = "json"
compression = "gzip"
The key detail here: the search layer receives the filtered stream, while the archive layer can take normalised but unfiltered data. That separation strengthens the operational and cost trade-off.
What should you watch operationally?
Once Vector is up, the real value comes from observing how it behaves. The checks I recommend:
- Buffer fill rate
- Write errors at sinks
- Per-source latency
- Number of dropped events
- Frequency of configuration changes
On a central log backbone in particular, silent data loss is more dangerous than a loud failure. That’s why the pipeline itself also has to be observed.
Conclusion
Building a centralised log pipeline with Vector is more than installing an agent. The real work is gathering log sources under a shared data and operations contract, reducing noise early, and sending the right data to the right destination. Observability maturity is usually defined less by the search tool you use and more by the discipline you apply when moving the data into it.