
Prometheus on its own is a strong starting point. But as metric volume grows and retention windows lengthen, it can turn into a central bottleneck. Especially when you’re building a shared observability platform for multiple clusters, teams, or customer segments, balancing retention duration against query performance with local TSDB alone becomes hard. Grafana Mimir steps in here, offering Prometheus-compatible storage and query capabilities at a more enterprise scale.
When should you consider Mimir?
Mimir starts to make sense once these signs appear:
- Prometheus instances frequently hitting memory pressure
- Queries getting visibly slower as retention windows grow
- A need for multi-tenant separation
- Wanting a consistent architecture for remote storage
The point isn’t just to hold more data; it’s to keep operational load under control as data volume grows.
Core architectural pieces
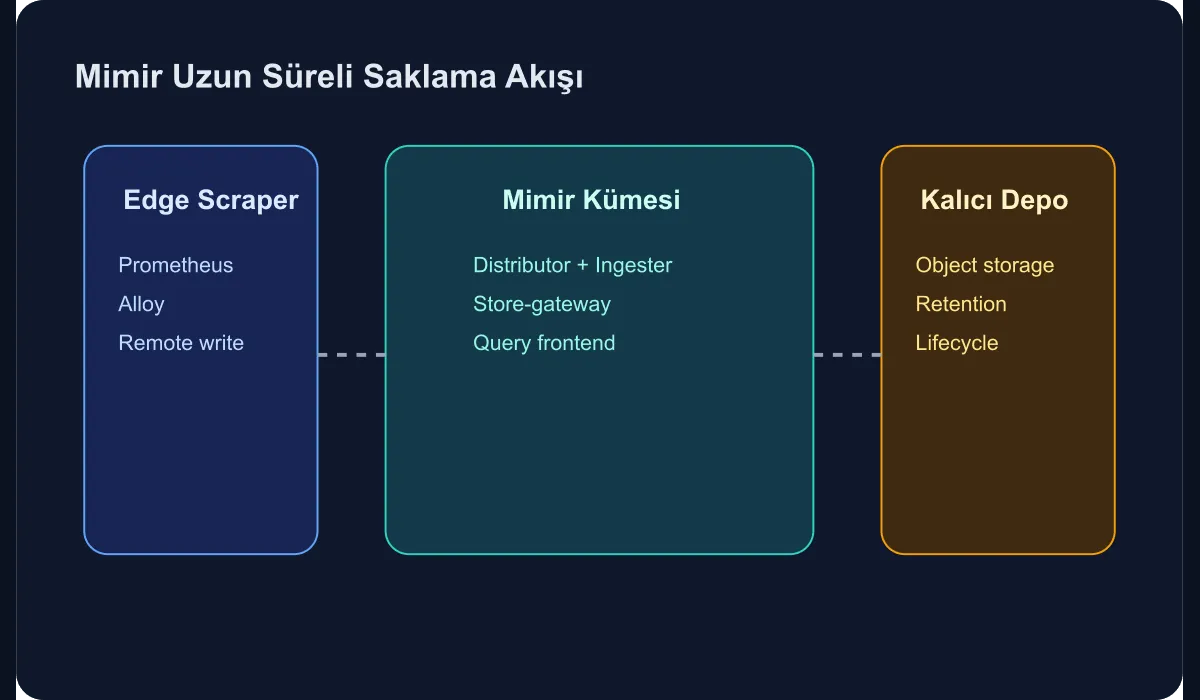
Before deployment, the role split needs to be clear. Even in a basic Mimir install, these components matter:
- Edge scrapers like Prometheus or Alloy
- Distributor and ingester layer
- Object-storage-backed durable metric store
- Querier and query-frontend
- Tenant and limit policies
In a small environment you can run monolithic mode, but for enterprise use, thinking about the components separately gives you a more accurate capacity plan.
A practical rollout flow
On the first pass, don’t try to migrate every scrape. It’s safer to connect one or two Prometheus sources to Mimir via remote write first. The general flow could be:
remote_write:
  - url: https://mimir.example.internal/api/v1/push
    headers:
      X-Scope-OrgID: platform-prod
    queue_config:
      capacity: 20000
      max_shards: 20
      min_shards: 4
Then validate the data flow against:
- ingestion latency
- rejected sample count
- label cardinality pressure
- query response time
Without doing this validation, scaling the retention window quickly leads to expensive surprises.
Why object storage choice is critical
Mimir’s economic edge comes largely from object storage. That makes bucket policy, lifecycle settings, and the network access model part of the architecture. Things to pay attention to:
- In-region access latency
- Server-side encryption
- Lifecycle handling for old blocks
- Backup and delete protections
In enterprise environments, settle tenant boundaries and bucket access models with the security team early.
How to manage a multi-tenant setup
The most common mistake is putting every team under a single tenant. It seems convenient at first, but limit, quota, and query isolation get lost. A healthier approach:
- draw the tenant boundary by team or environment,
- set up federation for shared dashboards,
- make global limits visible at the tenant level.
This way one team’s runaway metric won’t pressure the entire platform.
What to monitor operationally
Once Mimir is up, the real work starts. You also need to observe the platform’s own health:
- ingester memory and WAL pressure
- compaction durations
- query-frontend cache effectiveness
- distributor reject reasons
- object storage error rate
Treating Mimir as just a storage layer is a mistake — it’s a platform that needs active operations of its own.
Conclusion
Long-term metric retention with Grafana Mimir doesn’t mean walking away from Prometheus; it means supporting it at enterprise scale. When the right tenant boundaries, remote write discipline, object storage design, and cardinality control are in place, Mimir lengthens metric retention while improving query reliability and operational predictability together.