
After the OpenTelemetry Collector goes live, many teams feel relief: applications no longer talk directly to a backend, and the data flow runs through a central layer. But within a short time another problem surfaces. Starting to collect everything is easy; choosing which signals are actually needed is harder. This is where the filtering layer comes in. The aim is not to drop data — it is to govern data behavior.
Why is a filtering layer necessary?
If you treat the Collector purely as a forwarding agent, within a few weeks the following outcomes show up:
- Noisy log streams drive cost up
- Low-value trace spans make analysis harder
- Debug metrics become permanent fixtures in production
- Sensitive fields can land in the wrong backends
For that reason, the typical decision order on the Collector is:
- Define the signals to retain
- Choose the fields to enrich
- Determine the volume to drop
- Separate the destination backends
Sample architecture
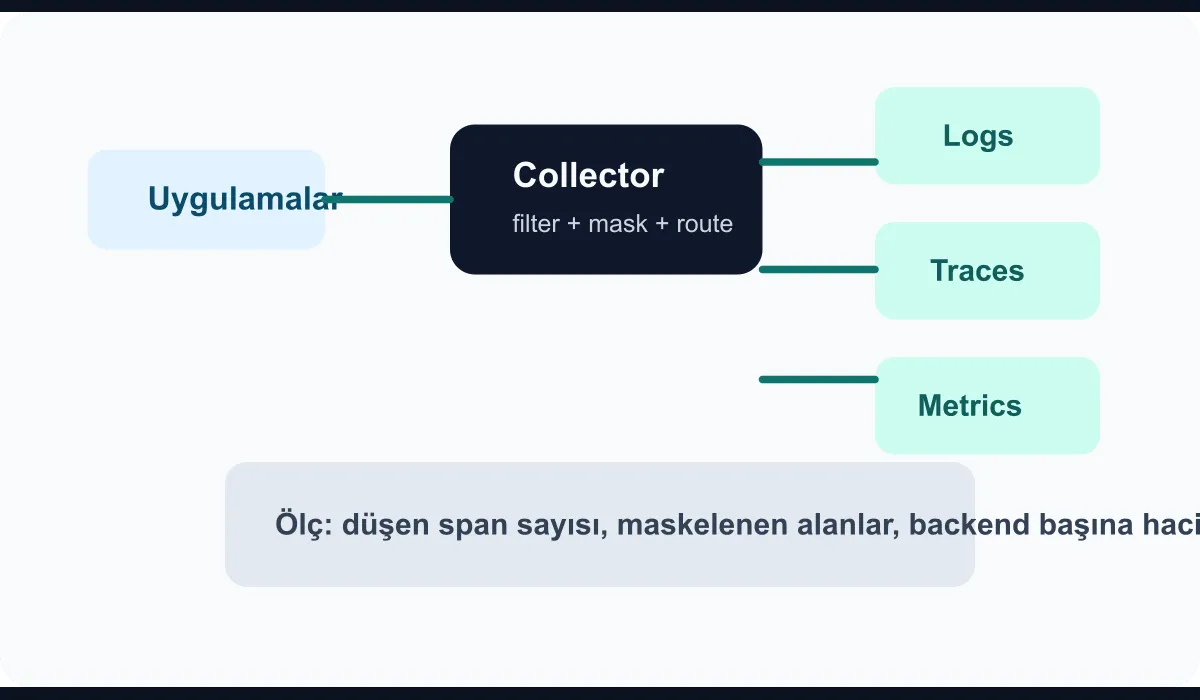
For a simple yet effective structure, you can think of a single Collector pipeline in three stages:
- Ingest layer: OTLP, syslog, or agent outputs flow into the Collector
- Filtering layer: low-value telemetry is dropped, PII is masked
- Routing layer: signals are dispatched to different backends
This model is especially useful in enterprise structures using a central observability stack.
Sample configuration
The example below provides a clean starting point that drops health-check spans, masks specific log fields, and routes metrics and traces to different destinations:
receivers:
  otlp:
    protocols:
      grpc:
      http:

processors:
  filter/drop_low_value_traces:
    error_mode: ignore
    traces:
      span:
        - 'attributes["http.route"] == "/healthz"'
        - 'attributes["http.route"] == "/readyz"'

  attributes/mask_sensitive:
    actions:
      - key: user.email
        action: delete
      - key: http.request.header.authorization
        action: delete

  resource/add_context:
    attributes:
      - key: deployment.environment
        value: production
        action: upsert

exporters:
  otlphttp/traces:
    endpoint: https://traces.internal/v1/traces

  prometheusremotewrite/metrics:
    endpoint: https://metrics.internal/api/v1/write

service:
  pipelines:
    traces:
      receivers: [otlp]
      processors: [filter/drop_low_value_traces, attributes/mask_sensitive, resource/add_context]
      exporters: [otlphttp/traces]
    metrics:
      receivers: [otlp]
      processors: [resource/add_context]
      exporters: [prometheusremotewrite/metrics]
This example does not fit every scenario; but it shows why applying filters at the Collector layer — rather than at the backend — matters.
Which signals should be filtered?
The rule sounds simple but is hard to apply. I find this ordering useful:
- High-volume health-check and readiness calls
- Debug log fields that add no analytical value
- Sensitive identity fields carrying regulatory risk
- Low-value events that repeat the same information
In contrast, the following signals should not be dropped lightly:
- Spans and logs in the error class
- Transaction signals from critical business workflows
- Metrics that feed the SLO calculation
- Records valuable for post-incident forensic review
How should the rollout be done?
Hardening the Collector filter all at once is risky. A safer order can look like:
- First produce only counters; do not drop
- Try candidate rules on a canary Collector
- Send full flow to one backend, filtered flow to another
- Watch for alarm and dashboard regressions
- Then perform the broad rollout
This approach prevents the “we cut cost but had no data during an incident” scenario.
Conclusion
Setting up a telemetry filtering layer with the OpenTelemetry Collector is not a hasty trim job aimed at reducing observability cost. Done right, it improves data quality, lowers security risk, and makes traffic to backends intentional. When you treat the Collector not just as a pipe but as a decision surface, the observability platform becomes a more sustainable structure.